September 8, 2025
Updated on
August 31, 2026
User Journey Mapping: A 6-Step Guide + B2B Example (2026)
Every department has a different idea of where your user journey falters. What's missing? A shared understanding of the entire journey. This is precisely where a user journey map comes in.



Table of contents
This guide provides two things: a complete step-by-step instruction and a consistent, illustrative B2B example (a fictional marketplace) that you can directly apply to your own product.
The hands-on examples in this guide are anonymized; the patterns behind them come from real client projects.
What is a User Journey Map?
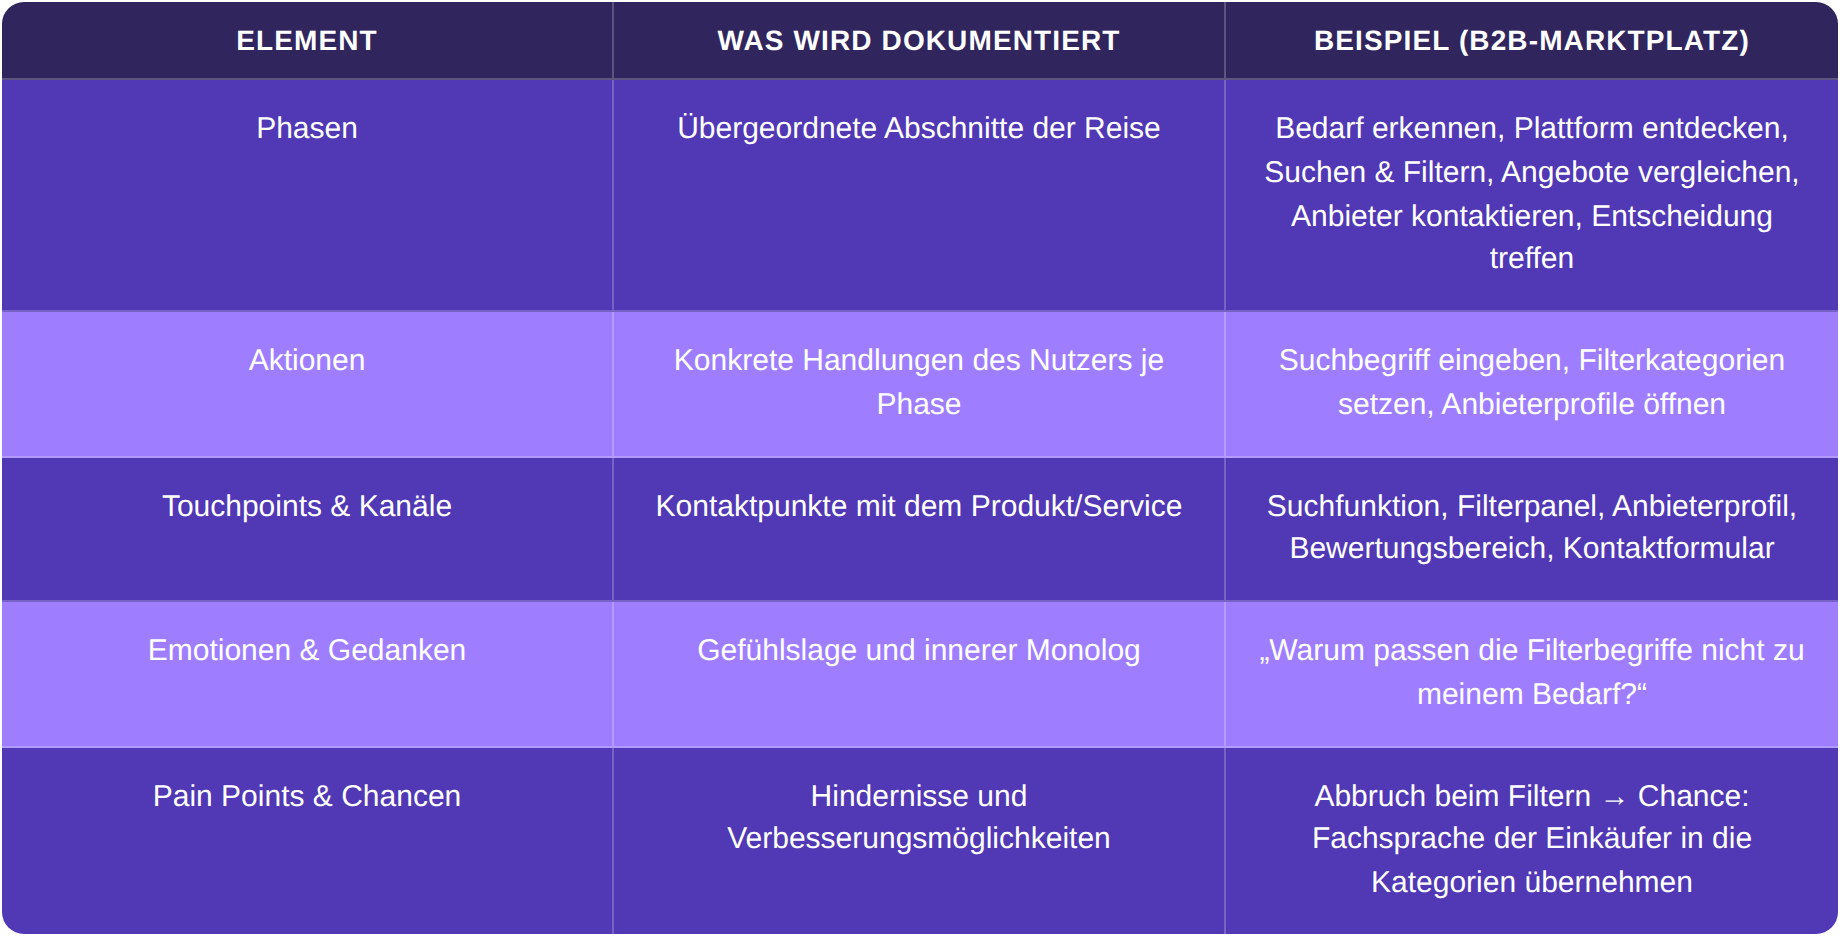
A user journey map is a visual representation of the experience a user goes through to achieve a specific goal with a product or service. Following a defined scenario, it documents phases, actions, touchpoints, emotions, and pain points to identify moments where the user experience can be specifically improved.
Important for context: A user journey map adopts the product and UX perspective. Instead of the entire customer lifecycle, it focuses on a specific user interaction. The customer journey (marketing perspective, from awareness to loyalty) is a related but different tool.
The Five Core Elements of a User Journey Map
Every map consists of the same basic building blocks. The following table illustrates, using the example of a fictional B2B marketplace, what is documented.
When is a journey map worthwhile? Three typical situations:
1. You are developing a new product and want to consider the user experience from the outset.
2. You have an existing product where users drop off at certain points and want to identify these friction points.
3. Your team (product, design, development) needs a shared understanding of the user perspective to set priorities.
The 6 Steps: How to Create a User Journey Map
The order of the steps is no coincidence. Each step builds on the previous one: Without a clear scope, no focused map can be created. Without a persona, it becomes arbitrary. Without documented touchpoints, the basis for the emotion curve is missing. Do not skip any step, even if it's naturally tempting to jump straight to the pain points.
The following example will be used throughout all six steps: a fictional B2B marketplace that connects service providers and buyers.
Step 1: Define the Scope
Before you write a single Post-it, you need clarity on one question: Which specific scenario should be mapped? The "entire user experience" would be far too much. Focus on one task, one user group, one goal.
For our example: The scope for the B2B marketplace is: "A buyer's first request for a quote on the platform, from search to provider selection."
Formulate your scope statement in one sentence following this pattern:
[Persona] wants to achieve [Goal] by using [Product/Channel].
For our example: "Thomas (Purchasing Manager) wants to find a suitable service provider by using the marketplace platform." This sentence becomes the North Star for everything that follows.
From our practice: even in full-day facilitated workshops, we rarely map more than two or three flows properly. When a product has several scenarios, we take the most important one first, work it through in depth, and come back to the others later. One flow in depth beats five on the surface.
Step 2: Select a Persona
Use an existing persona from your UX research. Only address one persona per journey map, as multiple personas in one map dilute the clarity. If you don't have any personas yet, that's the first step even before mapping.
For our example: Our persona is Thomas, 47, a purchasing manager in a mid-sized company. He has little time, a high need for security when selecting providers, and is skeptical of new platforms because he is personally accountable for poor decisions.
From our practice: when it can be arranged, we bring an actual person from the target group into the workshop. On a platform for an audience abroad in Europe, we did exactly that. A voice that really uses the product corrects assumptions faster than any team discussion. It is not always feasible, but when it works, it changes the whole map.
Step 3: Define the Scenario and Phases
The scenario describes the specific context: When, where, and under what circumstances does the task take place? The phases are the overarching sections of the journey. There isn't a fixed number of phases, but four to seven are typical.
For example: Thomas has been tasked with finding an external service provider for an internal project. His boss expects a shortlist by Friday. The phases:
- Identify Needs
- Discover Platform
- Search & Filter
- Compare Offers
- Contact Providers
- Make a Decision
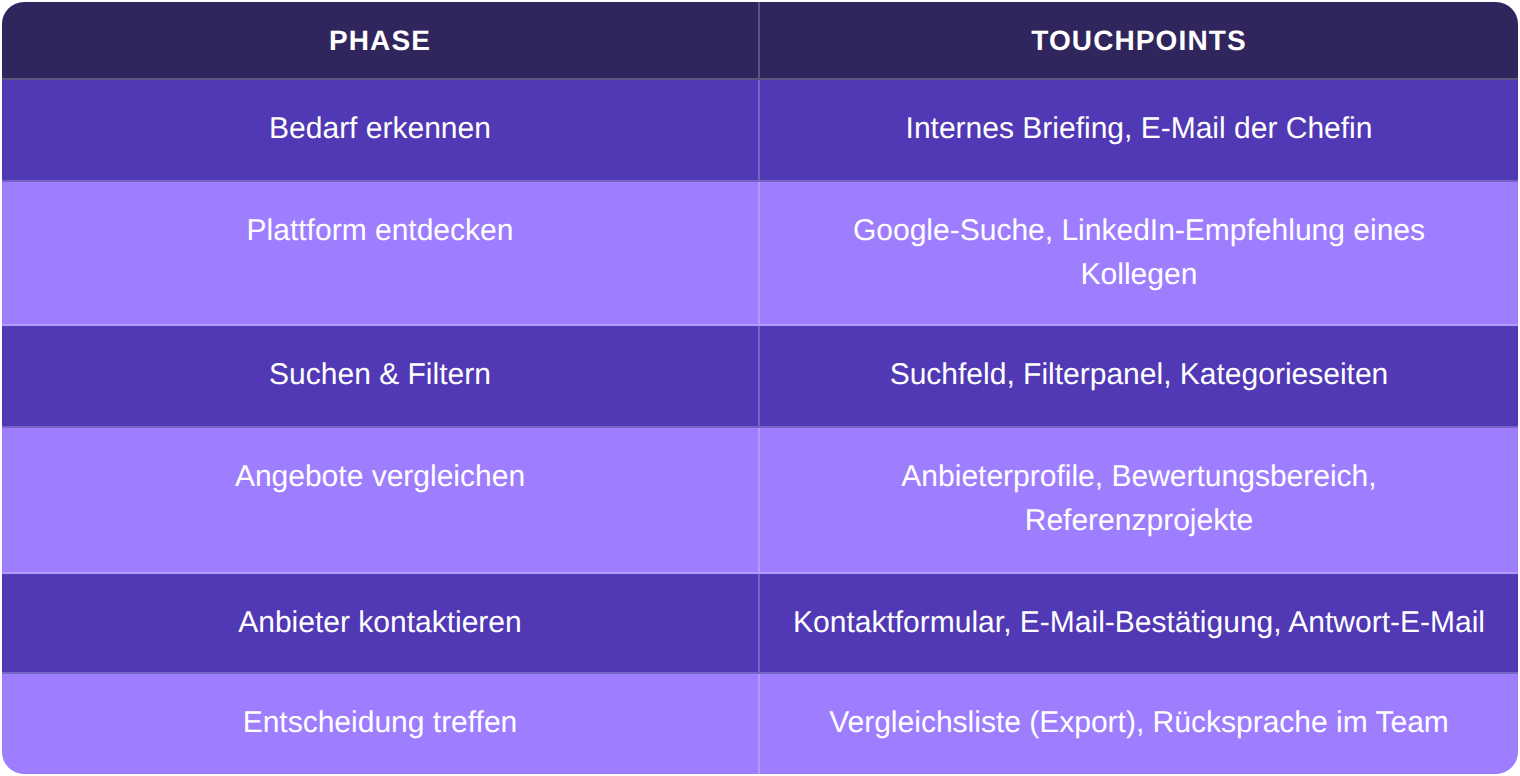
A common mistake is confusing phases (Step 3) with touchpoints (Step 4). Phases are overarching (e.g., "Search & Filter"). Touchpoints are the specific interaction points within a phase (e.g., search field, filter panel, results list).
A note from our practice: if your product has several target groups, each one needs its own flow. On a two-sided marketplace in the care sector, we mapped the journey once from the perspective of the person searching and once from the perspective of the facility receiving the request. Two perspectives, two maps.
Step 4: Capture Touchpoints and Channels
Now list all user contact points with the product for each phase. Think beyond the screen: digital touchpoints (website, app, email), analog (phone, trade fair, print), indirect (reviews, colleague recommendations).
From our practice, the most common mistake: teams map the screens and miss the experience in between. Home, detail page, cart, and the flow is considered done. The real thing happens between the screens. A user gets redirected, waits for a response that never comes, or returns frustrated. These moments belong on the map, even when they have no screen of their own.
A full inventory, including a ready-made B2B list, is available under Customer Journey Touchpoints.
For example:
Step 5: Document Emotions and Pain Points
Now the map comes to life. Document the emotional journey:
Where does the user feel secure? Where insecure, where frustrated?
This is based on research data: interviews, support tickets, session recordings, surveys. No assumptions without data.
The matching workshop format for this is the Empathy Workshop. Observable behaviour rather than assumptions comes from usability testing.
Here's an example of Thomas's emotional journey:
- Identifying the need: Neutral, slight time pressure – "I have to deliver by Friday."
- Discovering the platform: Cautiously optimistic – his colleague's recommendation builds initial trust.
- Searching & Filtering: Frustration mounts. The filter categories don't use his industry-specific terminology. After three minutes, Thomas gives up on filtering because too many irrelevant results appear.
- Comparing offers: Uncertainty. The provider profiles are structured differently, making a direct comparison difficult.
- Contacting providers: Relief after the first successful contact – a provider responds within two hours.
- Making a decision: Residual risk. Thomas lacks a standardized comparison view to justify his shortlist to his boss.
Formulate pain points as concretely as possible. "User is frustrated" helps no one. "Thomas gives up on filtering after 3 minutes because the category terms don't match his industry-specific terminology" – that's something you can address.
From our practice, a real pain point: on a project for a B2B marketplace that was already live, we ran into a classic dead end. Users sent off a request and then received no signal, no confirmation, no hint that anything had arrived at all. On the board we marked this gap in its own color. The fix was not a big feature: an automatic confirmation and an overview of your own requests in the account. You only spot gaps like this by walking the journey from the user's point of view, not by stepping through the existing screens.
Step 6: Identify Opportunities
Each pain point becomes a "How might we…" question. No ready-made solutions – the map provides the right questions, the team develops the answers.
For example:
- "How might we align the filter terms with the buyers' professional terminology?"
- "How might we enable a structured quote comparison that Thomas can export directly?"
- "How might we show provider response time as a quality indicator?"
Each of these questions becomes a backlog item, input for a Design Sprint, or the focus for the next research round. The map is not a document to be filed away. It drives decisions.
From our practice, prioritizing sometimes means leaving things out: we build the ideal journey and put the MVP version on top, the part that really matters. Later wishes go underneath as a future layer. On one project a client wanted to build a dedicated app alongside the web platform right away, even though its only added value would have been notifications. We advised against it, because the web platform had to carry first. A good map also leads to the insight to leave a planned feature out for now. That saves budget too.
The User Journey Map at a glance: Components, Tools, and Formats
You don't need a specialized tool for User Journey Mapping. What's crucial is that the team can work on the map together.
Here's a concise guide:
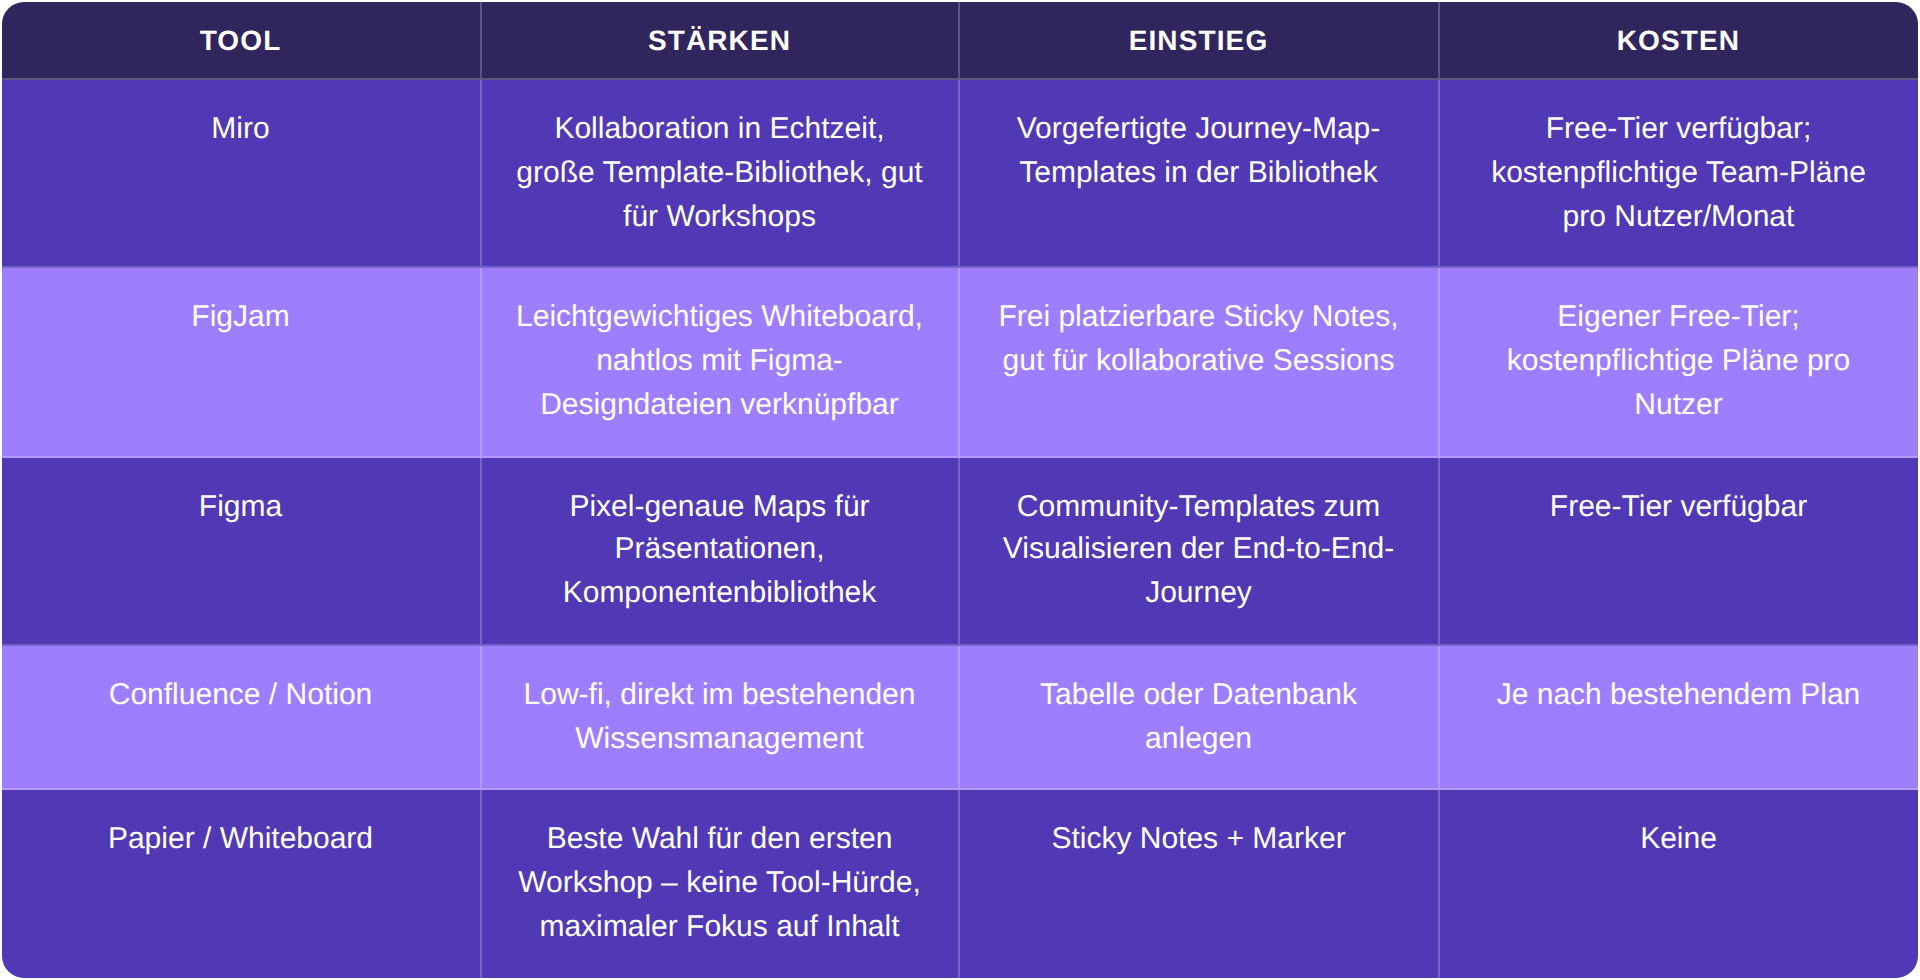
A journey map can be an A3 page or an interactive Miro board with linked research data. Format follows function. To begin, a simple table structure is enough.
Your map structure to replicate
You don't need a ready-made template to start, because the structure is intentionally simple. In your tool or on a whiteboard, create the five core elements as rows and the scope statement as a header row. For better clarity, you can split touchpoints and channels into two separate rows:
- Phases: the overarching sections of the journey (these will be your columns)
- Actions: what the user specifically does in each phase
- Touchpoints & Channels: the points of contact with the product and where the contact occurs (digital, analog, indirect)
- Emotions & Thoughts: the internal monologue for each phase
- Pain Points & Opportunities: obstacles and the derived "How might we..." questions
The columns are the phases from Step 3. The first version doesn't need more than that.
Hypothetical vs. Research-Based: What a User Journey Map Actually Changes
The following scenario is illustrative. Using a fictional marketplace, it demonstrates why the data foundation determines the value of a map.
Imagine a product team initially mapping the buyer's journey hypothetically, based solely on their own assumptions. The result would likely look convincing: all phases neatly arranged, the pain points plausible.
Now, the same team conducts five interviews with real buyers. The research-based map would likely tell a different story. The presumed main pain point (too few providers) turns out to be irrelevant. The actual main pain point? The filter terms don't match the buyers' technical language, which erodes trust in the app. This doesn't even appear in the hypothetical map.
How do you tell the difference? A hypothetical map contains phrases like "user might be frustrated." A research-based map contains quotes and observable behavior: "Thomas abandoned after 3 minutes." The latter leads to concrete design decisions, while the former tends to result in long discussions.
The dead end described above is exactly that kind of find. In a purely hypothetical map it would never have surfaced, because everyone on the team knew that a request 'works.' Only walking the journey from the user's point of view made it visible that nothing happened after the request was sent.
If you lack the data for a research-based map, a UX audit provides the foundation.
The outcome in this scenario: The team would prioritize revising the filter categories and develop an optimized comparison view. These are two features that wouldn't have made it onto the roadmap without the map.
The most common mistakes in user journey mapping
Four patterns come up in client projects again and again.
The first: thinking in screens. Many teams map sequences of screens and treat the screen flow as the journey. The real friction sits in between, in waiting times, redirects, and moments without clear feedback.
The second: too much at once. Pressing five flows into one session gives you five shallow maps. A clearly scoped scenario in depth is worth more.
The third: starting without a persona or data. Without a concrete persona the map becomes arbitrary, and without a research foundation it only reflects the team's assumptions. Both can be prepared before the first Post-it goes up.
The fourth: too many people in the room. A large workshop feels important but rarely produces better results. What matters is the right people with decision-making power, not the headcount.
Get started with your first map now
You now know how to create a user journey map. Why not apply it to your next feature right away and gain your first experience with the method?
Three concrete next steps:
- Define the scope in one sentence: Who wants to achieve what, with which product?
- Set up the map structure: the rows from the section above. In Miro, FigJam, or as a simple table, depending on where your team works.
- Invite your team: Block 90 minutes, bring personas and existing research data, fill the map together. This applies to your own first attempt. A fully facilitated workshop with several flows usually takes a whole day. How to facilitate that session is covered in our overview of UX workshop formats.
If you would rather have the map facilitated for you, here is how we run it: a full-day workshop with two facilitators, one moderating, one documenting. We prepare the board, prioritize during the workshop with dot voting, and digitize everything in Miro at the end. More on our page about User Journey Mapping for digital products.