June 30, 2026
Updated on
How to Calculate, Benchmark, and Interpret Usability KPIs Correctly
Durch fehlende oder falsch interpretierte Kennzahlen sind schon die besten Tests untergegangen.


Table of contents
You're in a stakeholder meeting, tasked with proving that the latest iteration has improved usability – but "it feels better" won't convince management or the budget committee. This is where many good tests fall short: not due to a lack of data, but because metrics are confused or misinterpreted (a SUS score is not a percentage, after all). This article clearly explains each key usability metric, shows you what it measures and what it doesn't, and provides you with a SUS interpretation table that you can use directly in your reporting.
Key Takeaways
Before we dive into the individual metrics, here are the key points you should take away from this article.
- SUS measures perceived usability on a scale of 0 to 100 – it is not a percentage. The widely cited industry average of 68 comes from a meta-analysis of over 500 SUS studies by Jeff Sauro and corresponds to the 50th percentile.
- Task Success Rate, Time on Task, and Error Rate measure actual behavior. SUS complements these hard metrics but does not replace them.
- A single metric is never enough. Combine qualitative and quantitative data, and plan for at least 15, preferably 20 to 30 responses for a reliable SUS score.
- Define your KPIs beforehand and prioritize them in the test report. Otherwise, the mountain of data will remain unused, without leading to any decisions.
Why Usability Must Be Measurable
Measurable KPIs transform "the UX feels better" into a statement that holds up in meetings – one you can defend to management, investors, and other teams. A number with a benchmark trumps any gut feeling when it comes to budget and prioritization.
The difference lies between subjective impression and verifiable insight. "Three users seemed confused" is an observation that quickly gets dismissed in discussions. "The Task Success Rate for checkout was 55 percent, the SUS 61 – both below benchmark" is a basis for making decisions.
The article clearly distinguishes between two measurement dimensions because they answer different questions:
- Perceived Usability – how easy does the product feel? Measured via SUS and SEQ.
- Actual Performance – what do users actually achieve? Measured via Task Success Rate, Time on Task, and Error Rate.
A quick clarification upfront: This article focuses on the operational testing level, meaning KPIs from specific usability tests. The business case – what poor UX costs and what ROI good UX design brings – is a separate topic, which we cover in our article on UX ROI.
System Usability Scale (SUS): Calculation, Benchmark, and Interpretation
The SUS is a standardized 10-item questionnaire that outputs the perceived usability of a product as a scale value from 0 to 100 – not a percentage. This very confusion is the most common error in reporting, and we're clearing it up right away.
The widely cited industry average of 68 comes from a meta-analysis of over 500 SUS studies by Jeff Sauro and marks the 50th percentile – half of all products score above it, half below. A SUS score above 68 is considered above average, anything below is considered below average.
The most important point for context: 68 does not mean "68 percent satisfied." Even though a SUS score can range from 0 to 100, it is not a percentage. A score of 70 out of 100 seems like 70 percent and sounds quite respectable – but in reality, it's only slightly above the average of 68 (approximately the 55th percentile according to Sauro's method), making it more average than above average. The correct interpretation is therefore: "slightly more usable than half of the tested products," not "70 percent of users are satisfied."
To ensure your score is comparable with the benchmark, you must use the established questionnaire version unchanged. A common translation of the 10 items in German-speaking countries is:
- I think that I would like to use this system frequently.
- I found the system unnecessarily complex.
- I thought the system was easy to use.
- I think that I would need the support of a technical person to be able to use this system.
- I found that the various functions in this system were well integrated.
- I thought there was too much inconsistency in this system.
- I would imagine that most people would learn to use this system very quickly.
- I found the system very cumbersome to use.
- I felt very confident using the system.
- I needed to learn a lot of things before I could get going with this system.
Do not change the wording and do not omit any items. As soon as you rephrase the scale, you lose comparability with the 68-point benchmark.
On sample size: Five responses provide a number, but little confidence. For a reliable SUS, you should collect at least 15, preferably 20 to 30 responses. We cover how many participants you need in total, depending on your test objective, separately in the article on participant numbers.
How to calculate the SUS score
The calculation follows a fixed scheme that accounts for the mixed tone of the questionnaire – odd-numbered items are phrased positively, even-numbered items negatively. For the odd-numbered items, subtract 1 from the response; for the even-numbered items, subtract the response from 5. Each item value is thus between 0 and 4, and you multiply the sum by 2.5, which results in a SUS score from 0 to 100.
A worked-out mini-example for a single person (responses on a 5-point scale):
- Item 1 (positive): Response 4 → 4 − 1 = 3
- Item 2 (negative): Response 2 → 5 − 2 = 3
- Item 3 (positive): Response 5 → 5 − 1 = 4
- Item 4 (negative): Response 2 → 5 − 2 = 3
- Item 5 (positive): Answer 4 → 4 − 1 = 3
- Item 6 (negative): Answer 2 → 5 − 2 = 3
- Item 7 (positive): Answer 5 → 5 − 1 = 4
- Item 8 (negative): Answer 1 → 5 − 1 = 4
- Item 9 (positive): Answer 4 → 4 − 1 = 3
- Item 10 (negative): Answer 2 → 5 − 2 = 3
Sum of item scores: 33. Multiplied by 2.5, this yields a SUS of 82.5 for this person. You calculate the overall SUS for your study by averaging the individual scores of all participants.
With small sample sizes, you should consider the confidence interval and avoid over-interpreting differences. When comparing scores, differences of 5 points or less – especially with small samples – may not be significant; a change from 72 to 75 is not necessarily a true improvement but could be sample variation, whereas a jump from 72 to 82 is likely real. A statement like "SUS: 79.8 (95% CI: 76.2 to 83.4)" signals to stakeholders that the true value is highly likely to be between 76 and 83.
SUS Interpretation Table
This table answers the question "What is a good SUS score?" and serves as a reference in your results report: Enter your calculated score, assign it to the corresponding row, and communicate its classification plus percentile instead of just a raw number.
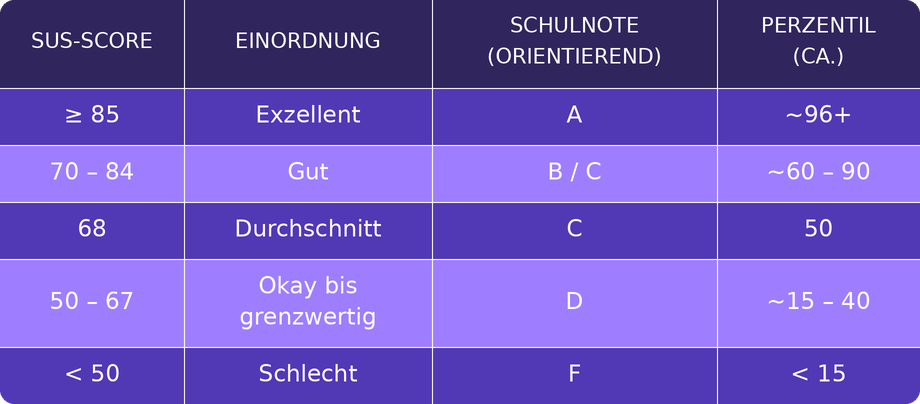
The percentile column should be read as a guide, not as an exact conversion. A few well-established anchor points help with classification: A raw SUS score of 74 corresponds to a percentile rank of 70 – meaning the product is more usable than 70 percent of all tested products and can be interpreted as a B-. To achieve an A, you need to score above 80.3 (the top approximately 10 percent of scores), while a score at the average of 68 is a C, and anything below 51 means an F (the bottom approximately 15 percent). On the adjective scale by Bangor et al., scores above 85 are considered "Excellent", "Good" is just above average at 71, and "OK" is around 51.
Important to know: Several grading and adjective scales are in use concurrently. Common frameworks include adjective ratings (Poor, OK, Good, Excellent), the academic grading scale from A to F, an acceptability scale (Not Acceptable, Marginal, Acceptable), and percentile ranks compared to previous studies. The table above is a pragmatic synthesis for everyday reporting – not a law of nature. It is crucial that you commit to one scale and use it consistently.
Task Success Rate, Time on Task, and Error Rate
These three metrics measure what users actually do, not just how they feel. They are the hard complement to the SUS – and often the most compelling argument in stakeholder discussions.
The Task Success Rate is the proportion of users who successfully complete a task, making it the most important "hard" metric. If 11 out of 15 participants manage to add a product to their cart and proceed to checkout, the success rate is approximately 73 percent. For this number to be reliable, the success criteria must be defined beforehand – what exactly counts as "successful"? You establish these criteria during task design, before the first test runs.
Time on Task measures efficiency: How long do users take to complete a task? If creating a new report takes an average of 4 minutes 30 seconds, and after a redesign, it only takes 2 minutes 10 seconds, that's a concrete, communicable efficiency gain.
Error Rate captures the frequency or proportion of errors per task – such as incorrectly filled form fields, aborted steps, or clicking the wrong element. A high error rate with low Time on Task is a typical warning sign: users are fast, but on the wrong path.
The following table answers the core question "What does each usability metric tell us?" and illustrates the division of labor between the metrics.
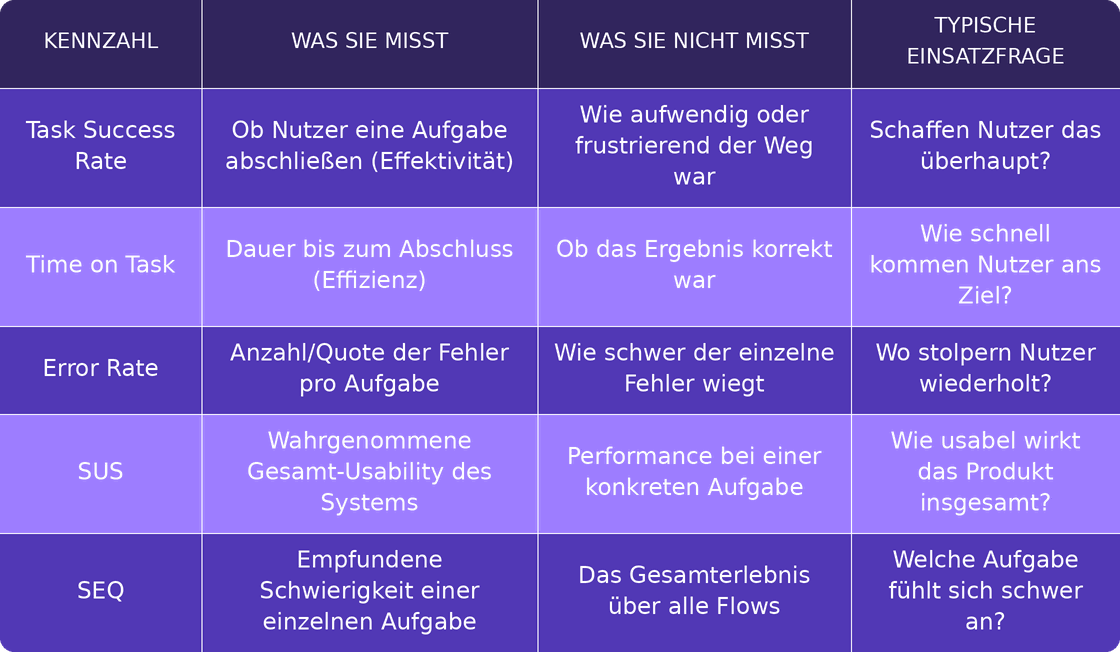
The principle behind it: The SUS complements these task performance metrics but never replaces them. Post-test questionnaires like the SUS measure the perceived usability of an entire system, while post-task scales point to problematic parts of a design. Only the combination of qualitative and quantitative data provides a complete picture.
SEQ and other subjective measures
The Single Ease Question (SEQ) captures how difficult a task was perceived immediately after completion – quickly, granularly, and task-specifically. The SEQ asks users to rate the difficulty of the recently completed activity on a 7-point scale from "very easy" to "very difficult."
The advantage over the SUS lies in its resolution. The SUS evaluates the overall system, whereas the SEQ points to individual problematic task flows. If the SUS looks okay, but a specific task is consistently rated poorly, you immediately know where to dig.
For orientation, there's a solid benchmark: Jeff Sauro has published benchmarks for SEQ responses and estimates the average on the 7-point scale to be around 5.3 to 5.5. Tasks that fall significantly below this should be examined more closely.
Further subjective measures like satisfaction ratings or NPS can complete the picture but shouldn't escalate into data collection for its own sake. More important is the discipline of always interpreting subjective measures alongside behavioral data. Some users rate everything with a 6 or 7, and about 14 percent classify a task as "very easy" even after failing to complete it. A high SEQ score with a low Task Success Rate is therefore not a contradiction but an indication that you need to look more closely.
Quantifying Qualitative Insights
Qualitative observations become reportable and prioritizable as soon as you make them quantifiable – by frequency, severity, and the proportion of affected users. This way, you don't lose the richness of the observation but gain the comparability that stakeholders need.
Here's how to proceed:
- Problem Frequency – How many users encountered the same problem?
- Severity – On a simple scale (e.g., cosmetic, annoying, blocking): How much does the problem hinder the user from achieving their goal?
- Proportion of Affected Users – What percentage of participants were affected?
- Recurrence Rate Across Sessions – Does the problem occur consistently, or was it an isolated incident?
An example: "Several users stumbled during checkout" becomes "6 out of 15 participants (40 percent) overlooked the discount code field, severity annoying, reproduced in every second session." The first phrasing invites discussion, the second lands at the top of the prioritization list.
This way, qualitative findings become just as robust for stakeholders as your quantitative KPIs – and can be weighed against each other in the same report.
Anchoring KPIs in the Test Report
A raw data dump is not a basis for decision-making. Value is only created when KPIs are prioritized and linked to concrete actions – otherwise, the mountain of data will sit in the Confluence folder, and no one will act.
A good results report is structured by impact, not by the order of tasks. It should:
- sort the most important KPIs by impact (what costs the most in terms of conversion, time, or trust?),
- link each finding to a concrete recommendation,
- assign responsibility and a rough estimate to transform insights into actionable tasks.
This is precisely where measurement becomes decision-making. If you need a test that doesn't just collect numbers but culminates in a prioritized, defensible report, a Usability Test with a measurable results report is the logical next step – the KPIs from this article are exactly what will be reported in it.
For a deeper dive into related topics, these resources can help: success criteria, which later become KPIs, are defined during task design; we cover suitable analysis tools in our tools article; the business case for UX ROI can be found separately; and our Usability Testing Guide provides a comprehensive overview.
What you should do next
Before your next test, determine which KPIs you will collect – at least SUS plus Task Success Rate – and plan for enough participants so that the data is reliable. This single upfront decision determines whether your report will stand up in the meeting or be picked apart.
If you need a defensible results report with prioritized KPIs, request a free initial consultation with brightside Studio. We help you define the right metrics for your product and prepare them in a way that supports prioritization decisions.
FAQ: Calculating and Interpreting Usability KPIs Correctly
How is Usability Measured?
Usability is measured using a combination of subjective and behavioral metrics. Subjective measures like the SUS and SEQ capture how easy a product feels; behavioral data such as Task Success Rate, Time on Task, and Error Rate show what users actually accomplish. Only by combining both dimensions do you get a complete, robust picture.
What is a good SUS score?
A SUS score above 68 is considered above average, anything below is considered below average. If your score is above 80, you belong to the top 10 to 15 percent. Scores of approximately 85 and above are considered excellent. You can find the exact classification with grade and percentile in the SUS interpretation table above.
What does a SUS of 68 mean?
A SUS of 68 is a scale value at the 50th percentile – half of all tested products score above it, half below. A SUS score of 68 does not mean that 68 percent of users found the product usable or are 68 percent satisfied. It is not a percentage, but simply the average you can use as a benchmark.
What are the UX KPIs?
The central usability KPIs are the System Usability Scale (SUS) for perceived overall usability, the Single Ease Question (SEQ) for the perceived difficulty of individual tasks, and three behavioral metrics: Task Success Rate, Time on Task, and Error Rate. Subjective and behavioral metrics complement each other – neither replaces the other.
How many participants do I need for a robust SUS?
For a robust SUS, you should collect at least 15, preferably 20 to 30 responses. Five responses will give you a number, but with low confidence – for small sample sizes, you should always include the confidence interval. We cover how many participants you need in total, depending on your test goal, in detail in our article on participant numbers.
Does the SUS replace other metrics?
No. The SUS complements task performance metrics, but does not replace them. It measures the perceived usability of an entire system, while post-task measures point to problematic parts of a design. Therefore, always read subjective and behavioral metrics together to avoid misinterpretations.